The Geography of Response: A UK Postcode-Sector Framework for Direct Mail
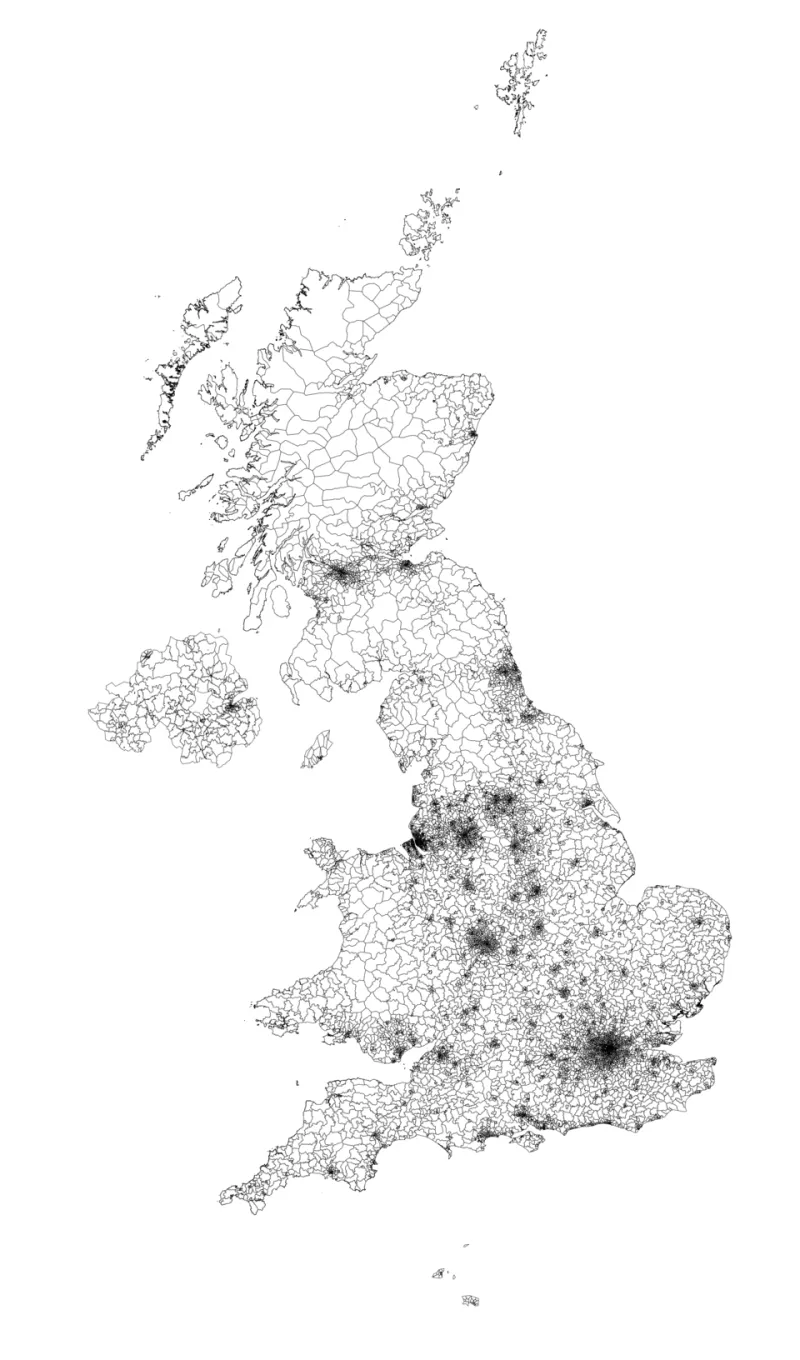
Photo: Anameofmyveryown, CC BY-SA 3.0, via Wikimedia Commons
Postcode targeting is often treated as a list-buying exercise: choose a few affluent sectors, buy the addresses and send the mailer. In 2026, that approach leaves value on the table. A tighter geography can cut waste, but it can also shrink response if the catchment is defined too narrowly or the offer is not adapted to local conditions. The playbook below is a repeatable framework for UK marketers who want geography to improve incrementality, not just reduce volume.
Start with catchment, not list size
Begin with the commercial catchment. For a retail or service business, define the area by drive time rather than a fixed radius. A 15-minute drive in a dense city and a 15-minute drive in a rural county describe very different populations. For B2B, the catchment may be a 45-minute drive, a rail journey or a defined sales territory.
Map the catchment using postcode sector centroids. A postcode sector is the outward code plus the first digit of the inward code, such as LS16 5. It is granular enough to reflect local variation and stable enough to plan against. Do not start with a bought list and then draw a catchment around it; that reverses the logic and hides gaps.
Rank sectors on four filters
A useful sector score combines four filters.
First, demand density. Use existing customer records, enquiry postcodes, web analytics and appointment data to see where demand already concentrates. A sector with no current customers may still be a growth area, but it needs a separate rationale.
Second, local demographics. Use ONS output area data, tenure, household composition and deprivation deciles rather than a single affluence score. A high-income sector with low owner-occupation may be a poor fit for a home-improvement offer; a mixed sector with young families may be strong for a subscription product.
Third, access. Drive time, parking, public transport and the presence of a branch or showroom all affect response. A sector that looks strong on demographics can fail if the journey is inconvenient.
Fourth, competitive and cannibalisation risk. Check whether the sector is already well served, whether existing customers would be mailed unnecessarily and whether the offer would pull demand from a nearby location.
Score each sector, then rank. Keep the scoring visible so that sales, finance and marketing can challenge the weights.
Overlay local demographics without stereotyping
Demographic profiling is most useful when it explains behaviour, not when it substitutes for it. A sector with a high proportion of owner-occupiers may be relevant for a kitchen showroom, but the offer still needs to reflect local housing stock, age of property and planning constraints.
Use profiling to choose the proposition, not just the list. A sector with many rented flats may respond to a landlord-focused offer; a sector with older detached housing may respond to a maintenance or accessibility angle. The same mailer sent to both is a compromise that usually underperforms.
Design the offer for the geography
Geography should show up in the creative. Reference the nearest branch, the local delivery time, the parking situation or the relevant service radius. Use a postcode-sector-specific landing page or QR route so that response can be measured without guesswork.
Avoid over-localising to the point of absurdity. The test is whether the local reference changes the recipient's judgement about convenience, relevance or trust. If it does not, it is decoration.
A UK example: Leeds bathroom showroom
A Leeds bathroom showroom wants to increase booked design consultations. Its catchment is a 20-minute drive from the showroom. The marketing lead pulls existing customer and enquiry postcodes, then ranks postcode sectors within that drive time.
High-scoring sectors include LS16 5, LS17 7 and LS18 4, where owner-occupation, household income and drive time align with the showroom's previous best customers. Lower-scoring sectors are not excluded entirely; they are held back for a separate test.
The campaign uses three cells: high-score sectors, lower-score sectors and a matched holdout. The mailer offers a free design consultation with a local installation slot. Response is measured as booked appointments per 1,000 households and cost per incremental appointment.
If the high-score sectors produce 0.8% response and the lower-score sectors produce 0.3%, the headline looks clear. But the commercial question is whether the high-score campaign produced incremental appointments beyond what would have happened anyway. The holdout answers that. If the high-score cell beats its holdout by a meaningful margin and the lower-score cell does not, the geography is doing real work.
Judge incremental response, not lower volume
A tighter geography will almost always reduce volume. That is not the objective. The objective is to improve incremental response per pound spent.
Set the measurement rules before the campaign. Define the primary KPI, the holdout design, the test duration and the decision threshold. Use matched control cells rather than comparing this year's response rate with last year's. Allow for spillover: a mailer to one sector can influence a neighbouring sector, so keep control areas separate.
Calculate cost per incremental response, not cost per response. Include print, postage, data, creative and fulfilment. If the tighter geography lowers volume but raises cost per incremental appointment, it has failed commercially, even if the response rate looks better.
Operational checks before the print run
Confirm that postcode sectors are correctly assigned, that gone-away and bereavement suppressions are applied, and that the list is PAF-cleaned. Check that each test cell has enough households to produce a readable result. Avoid cells so small that a handful of responses distorts the conclusion.
Finally, write down what the campaign is meant to prove. A geography playbook is not a one-off map. It is a repeatable process for choosing where to spend, what to say and how to judge whether the spend created incremental demand.